Have you ever met someone at work who you thought was a tyrant, but then they were significantly less dominant when at a social function? Or have you ever met a polite, deferential team member that seemed to come out of their shell and transform into a party animal when dealing with others outside the office?
This chameleon-like behaviour; an on-duty/off-duty masquerade, is one of the intriguing aspects of how we present ourselves to the world. Just like our reptilian friend, we each have a natural state (the way we prefer to behave and communicate) and we have an adapted state (what we perceive our environment requires for success or survival).
This difference in people's natural and adapted behaviour, is reflected in the 2 graphs produced in the DISC Report.
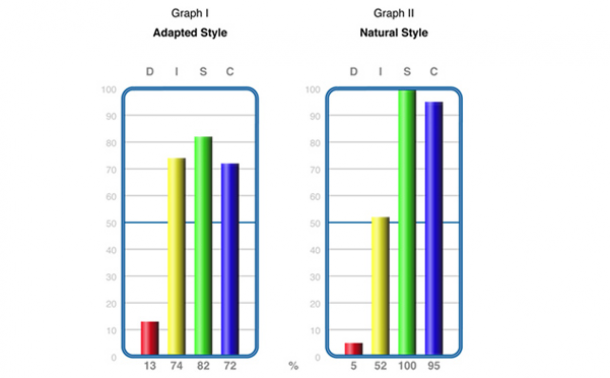
The Natural Graph (on the right) represents the person's most natural (or comfortable) behavioural preference. This is how a person would choose to behave when around close friends, family or at home when nobody is around.
The Adapted Graph (on the left) represents the person's RESPONSE TO THE ENVIRONMENT (usually the workplace). Some people call this graph the 'Work Style' or 'Social Mask'. It can be thought of as how a person will tend to act around strangers, colleagues and acquaintances that they don't know very well. This graph, in many cases, reflects the behaviour that the person believes is appropriate in order to meet the demands of the job.
The Energy Line:
The 50% line is called the "Energy Line." With any factor above the energy line on the natural graph, this means that the person does not have to exert energy in order to display that trait (i.e. that behaviour will just come out naturally). Conversely, any factor below the 50% line on the natural graph means that the person will need to exert more energy in order to display that trait.
E.g. In the graph above, if the person's role required them to be a "D" all day long, this would require an enormous amount of effort in order to push their D above the energy line (it would be very uncomfortable for the individual).
Think "Battery Power"
When we are in our Natural state, we are plugged into the mains power outlet (i.e. we have full power). As soon as we start adapting our behaviour we are running on "battery" power. Hence, if we habitually need to adapt our behaviour for long periods, we will eventually run out of energy and need to revert back to our normal behavioural preference.

Shifts in Adapted and Natural Style:
When the Natural and Adapted style are exactly the same (or a similar shape) this usually indicates that a person is in a role that suits them (behaviourally speaking at least).
It does not mean that it is "bad" to have a different adapted graph. It only indicates that the person is making a conscious effort to change their natural behaviour in order to either succeed or survive in their environment. Adapting our behaviour is necessary everyday to some extent in all our lives, but it's only when it's done to a significant level, over a long period of time, that it can lead to stress (or to burnout in more severe cases).
If you see shifts between the 2 graphs, you must consider its significance and what the cause might be. E.g. if a person has only 10% C on their natural style and then this jumps up to 60% on their adapted, this may indicate that the are having to do a lot of analytical, detail-oriented tasks, such as work involving quality control, compliance or legal administration. Of course, we don't know precisely what is causing the shift, so it's important to never assume that you know what the reason is. The rule of thumb is: they are the experts on their own on lives, just ask them what they think it means.
More Information:
For more information on graph reading:
Refer to The DISC Facilitator's Guide (a manual for creating and running DISC training activities) and The Universal Language DISC: A Reference Manual (the only full reference manual in the world on DISC) - provided as part of your DISC Accreditation.


/how%20to%20talk%20%20about%20disc%20on%20social%20media.png?width=374&name=how%20to%20talk%20%20about%20disc%20on%20social%20media.png)
We Would Like to Hear From You (0 Comments)