Psychological safety gives senior leaders new, actionable insights into staff productivity that significantly improve their organisation’s financial performance.
This article was originally published on LinkedIn by Alex Glassey and titled, "Psychological Safety Is A Fundamental Management Concept." It is republished here with permission. As a very comprehensive article, it was quite long in its original form, so we have broken it into two parts. You are reading part 2, and you can read part 1 (an introduction to the topic) here.
Psychological Safety Varies Across An Organisation
Organisations depend on standardisation for efficiency and uniformity. This includes how people are selected, hired, trained and managed. But people are complex and the interplay between them multiplies this complexity. This is reflected in their psychological safety and is captured by the PS25™.
A national organisation administered the PS25™ across its sales division and received 750 responses. This Conductor chart(3) shows the participants’ psychological safety across the division:
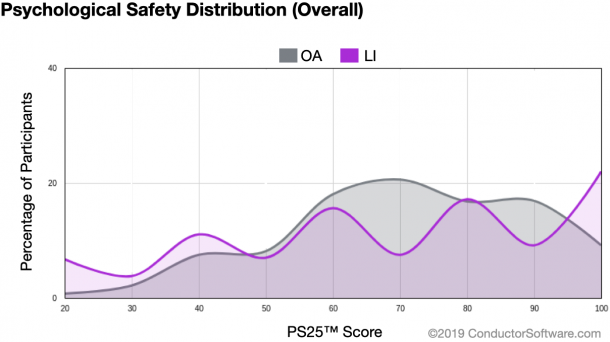
The grey region shows the distribution of everyone’s overall psychological safety score (OA). Scores over 80 are good to excellent. These people are better able to communicate and collaborate. They feel well supported by the organisation and each other. They are more resilient and more productive.
Scores between 60 and 80 indicate that real or perceived obstacles are impacting communication and collaboration. People feel less certain. They may lack clarity. They may have lower trust in each other, their supervisor, and the organisation.
Scores below 60 are low and highlight areas of concern for the organisation and its staff. People here feel unsupported and under threat. They are more resistant to change. Absenteeism and turnover is higher. Productivity and engagement are low.
The purple region shows the leadership influence score (LI), that is, how the immediate supervisor contributes to the individuals’ sense of psychological safety.
Prior to this survey management had expected consistency. They were surprised to see how much psychological safety varied across their organisation. They were heartened that so many staff felt psychologically safe but concerned by the number who felt unsafe.
Psychological Safety Varies From Team To TeamBecause psychological safety varies from person to person in an organisation, it is natural to expect it to vary from team to team. The chart below is from the same division. It shows each sales team as a vertical slice and each question’s response as a colour-coded square:
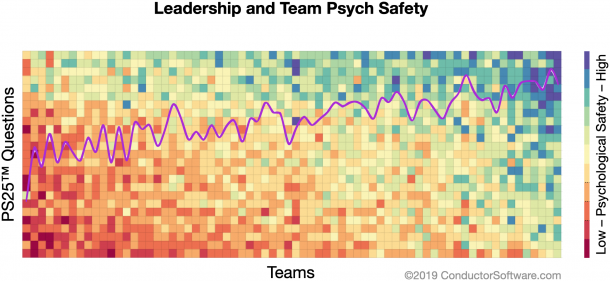
Each team has a distinct psychological safety personality with different strengths and weaknesses. This, despite consistent hiring, training and management practices across the organisation.
Psychological Safety Is Influenced By Leadership
A team’s direct supervisor significantly impacts the psychological safety experienced by a team. Each of us knows this from our school days. The same group of kids could respond very differently from one hour to the next solely because of a change in teachers.
The purple line that overlays the grid above shows the Leadership Influence score for each team. Statistical analysis confirms the visual impression that Leadership Influence strongly correlates with team psychological safety.
Psychological Safety Correlates With Key Performance Indicators
People are responsible for organisational productivity. After all, if there are no people, there is no productivity.
It is straightforward to link items like training, equipment and working conditions with their effect on productivity. They are easy to see and measure.
It has been much more difficult to connect productivity with people’s inner workings which are less visible and less tangible.
One of the best known attempts at this is described in Gallup’s 2016 paper, “The Relationship Between Engagement at Work and Organisational Outcomes”. This meta-analysis of 339 studies across 230 organisations and 1.8 million people said that employee engagement correlates with nine business outcomes:
- customer loyalty,
- productivity,
- profitability,
- employee turnover,
- employee safety incidents,
- absenteeism,
- shrinkage,
- patient safety incidents, and
- quality.
Psychological safety makes the process easier and more accessible.
Psychological safety as measured by the PS25™ can correlate with key performance indicators (KPIs) within a single organisation. For example, this Conductor chart(3) shows how each PS25™ statement correlates with “sales conversion %” for the sales division introduced above:
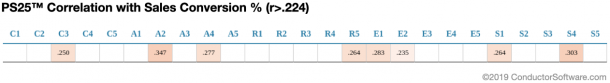
In this organisation, eight statements significantly correlate with the sales conversion rate. This doesn’t mean that psychological safety causes higher conversion rates. It simply observes that teams with higher psychological safety were statistically more likely to have higher conversion rates.
Other organisations have seen strong correlations with absenteeism and customer return visits. In one organisation, psychological safety measured by the PS25™ predicted customer satisfaction.
Psychological Safety Provides Fresh Insights
KPIs are often used by themselves in uni-dimensional comparisons. For example, sales teams are ranked from “best” to “worst” based solely on their sales conversion rates. Comparisons like this provide little insight into potential solutions and no insight into the people involved.
Adding an appropriate second dimension deepens understanding, spurs new questions and invites further discussion into potential solutions.
The following Conductor chart(3) compares absenteeism rates in 15 teams with one aspect of psychological safety, “Work is allocated fairly in my team.”
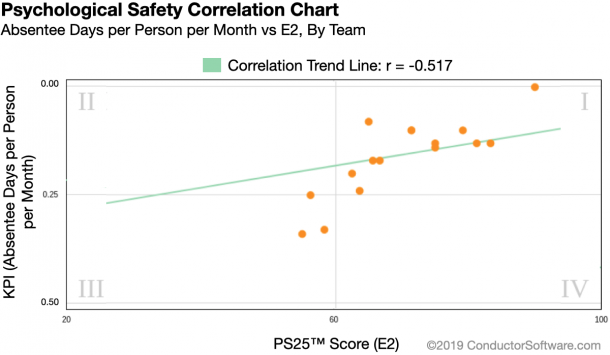
As before, no causation is implied. A high negative correlation (r = -.517) simply points out that teams that feel work is allocated fairly are more likely to have lower absenteeism and vice versa.
Psychological Safety Highlights Financial Opportunities
We increase the usefulness of the above chart when we quantify the financial impact of potential improvements. This is done by internally benchmarking an organisation’s KPI data. In this case, it helps us answer the question, “How much could we potentially save by reducing absenteeism?”
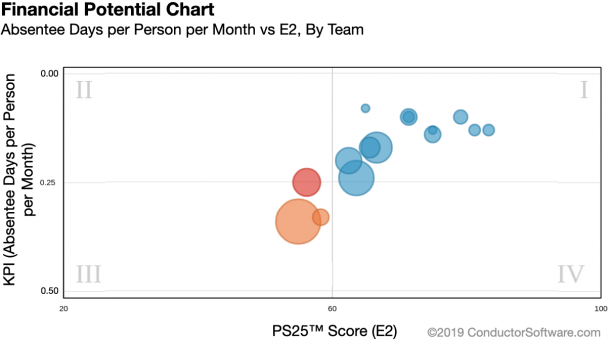
The Conductor chart(3) above is the same as the previous chart with one difference: it shows the potential improvement in dollars by varying the size of each team’s bubble.
Managers can now see a potential issue and quantify it in financial terms. The correlation with psychological safety offers a potential solution, for example, “How could we remedy the feeling that work is allocated unfairly?” The size and position of the bubbles help with prioritisation. Here’s a similar Conductor chart(3) for our friends in the sales division. Internal benchmarking highlighted potential revenue improvements of millions of dollars per month:
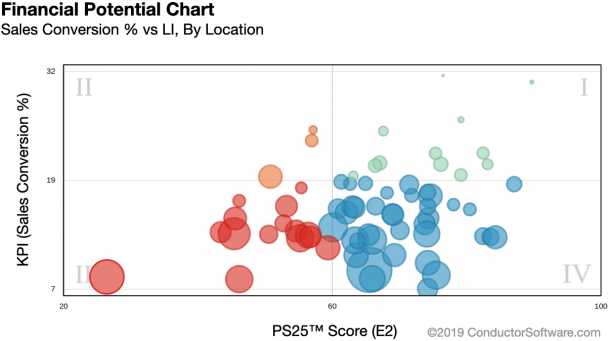
The chart compares ‘sales conversion %’ with the Leadership Influence score which significantly correlate. Teams with managers who supported psychological safety were more likely to have higher sales conversion rates and vice versa. The head of the division called this “a target-rich environment.”
Psychological Safety Is Actionable
While it requires some skill, improving psychological safety is straightforward. Psychological safety is clearly defined in the literature and so can be well understood. Improving it relies on common sense fundamentals that resonate with most people.
The charts above help managers prioritise issues and opportunities. In addition, the statements in the PS25™ survey use clear and simple language. They naturally lead to existing solutions like training and coaching, or they provide a clear business case for additional skill development. The following Conductor report snippet(3) is an example of how the PS25™ and KPIs can be brought together to help one team discuss how to improve its sales conversion rates and customer satisfaction:
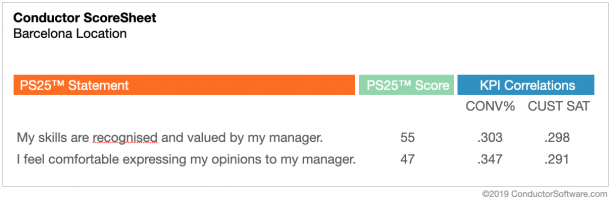
At first blush, it’s not obvious how these two statements directly affect either KPI. Managers are used to working with things like sales skills and product knowledge that have an obvious connection to sales performance and customer satisfaction. However, with some reflection, the link between manager recognition, employee confidence and a customer purchase will emerge. Psychological safety’s impact on a KPI may not be as obvious as, say, product knowledge, but it is just as important.
Using reports like this, the sales division focused on improving specific areas of psychological safety in its teams. Within 120 days their sales conversion rate rose by 14.08% resulting in millions of dollars of additional revenue.
Psychological Safety Requires That Teams Be Held Accountable
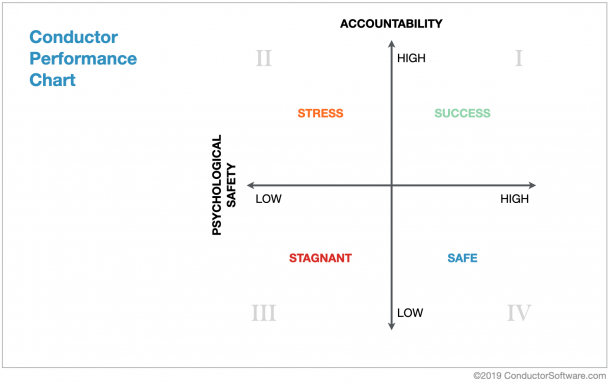
The traditional approach of holding people accountable to KPIs without considering psychological safety leads to a performance gap. But focusing only on psychological safety doesn’t optimise performance either. Both are needed. Employees must be held accountable in a psychologically safe way.
The chart below illustrates this. Each quadrant has distinct attributes. Quadrant II holds teams accountable with less concern for their people. Performance may be acceptable but teams may experience additional overhead from stress, absenteeism and turnover. In quadrant IV, people feel very psychologically safe but may be allowed to underperform. Quadrant I brings accountability together with psychological safety to create stable, high-performing teams.
Psychological Safety Is A Fundamental Management Concept
A fundamental management concept helps leaders achieve their organisation’s strategic goals. Its insights are used to quantify and prioritise risks and opportunities. It leads to better utilisation of key resources. It recommends actions that move an organisation forward. In short, it supports strategic decision-making.
The concept of psychological safety evolved from a century of research into the human dynamics of workplace performance. It identifies the core biological driver of human behaviour. It understands that we operate in a social context. We yearn to belong; we fear social rejection; our actions reflect this.
Psychological safety is a key driver of employee behaviour. As measured by the PS25™, it correlates with an organisation’s KPIs. Conductor integrates psychological safety levels seamlessly with traditional management tools such as internal benchmarking where it helps managers identify and prioritise risks and opportunities.
Finally, psychological safety shows how to reduce the conflict between people and bottom-line performance. Labour is no longer a necessary expense to be minimised. Rather, it is a rich resource that, when appropriately managed, aligns staff and leaders in the shared pursuit of the organisation’s purpose and potential.
About Conductor Software
ConductorSoftware.com is a self-serve SaaS platform that brings psychological safety and bottom-line performance together. We use Conductor to measure psychological safety, perform internal benchmarking using your KPIs, and link them so the best possible decisions can be made.
About the Author
Alex Glassey is co-founder and Chief Innovation Officer of Conductor Software. He helps senior management integrate their people and productivity strategies. He is based in Victoria, Canada.
Endnotes and Further Reading
(1) What Google Learned From Its Quest To Build The Perfect Team, Duhigg, Charles, New York Times Magazine, Feb 28, 2016
(2) Managing With the Brain in Mind, Rock, David, strategy + business, Aug 27, 2009
(3) Charts and reports from ConductorSoftware.com
Psychological Safety and Learning Behaviour In Work Teams, Edmondson, Amy, Administrative Science Quarterly, Vol. 44, No. 2, June 1999
The Relationship Between Engagement at Work and Organisational Outcomes, Harker, James K. et. al., Gallup.com, April 2016
The Importance of Psychological Safety, Edmondson, Amy, HR Magazine, December 4, 2018  This is Part 2 of the original article. Click this link to read Part 1 for an introduction to psychological safety.


.png?width=374&name=Nutshell%20-%20Appreciative%20Inquiry%20(4-D%20Cycle).png)
We Would Like to Hear From You (0 Comments)