This article explores a process for walking someone through the results of their DISC graph as part of a coaching session.
If you would like more information about the process for going through every page in the DISC profile (i.e., from cover to cover) please refer to the Success Discovery Process (SDP). This document serves as a companion to the DISC profile, used as a step-by-step walk through with questions for the participant to fill in along the way. This is provided as part of your DISC Accreditation. For more information, please email info@dtssydney.com
The Graph Reading Process:
This is what you might call the 'High C' version — it looks quite structured and contains a fair bit of detail. However, this is not the one and only process we use for debriefing profiles, and is not intended to be a strict system that must be followed. This is only designed to serve as a guide — a flexible template — for helping to create a process that works best for your needs. Feel free to adapt it.
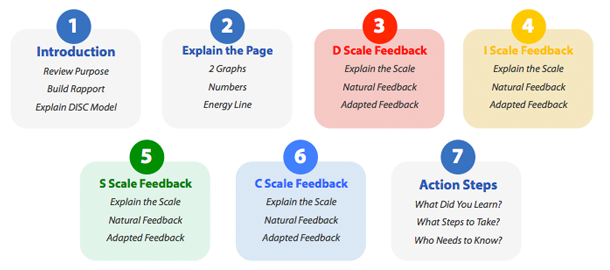
1. Introduction
Review the Purpose:
What is the purpose of this coaching session? Are you debriefing a salesperson, engineer, manager, CEO or a new recruit? Is the goal simply to improve their self-awareness, communication skills, and team relationships, or is there a more specific outcome that you need to keep in mind? Begin the session by discussing your coachee's expectations and goals.
Build Rapport:
What is the nature of your relationship with this person? Can they speak openly with you, or will they be more guarded? It might be a good idea to spend some time to get to know each other. Introduce yourself: Your background, experience, passions, and even share your DISC profile with them.
Explain the DISC Model:
This is where you introduce them to the DISC model, theory and basic principles.
Sample Script: "Before we delve into your DISC profile, let me start by setting some context for what this tool is all about. The DISC profile is one of the most widespread professional development tools taken by millions of people every year and used by hundreds of thousands of companies around the world, including about 75% of the Fortune 500. The thing that I think you’ll like most about this tool is that it is simple and practical — it's not some abstract university theory, and you won't need to have any kind of background in psychology.
This is a tool to help understand one particularly important element of your personality: Your behavioural style. By 'style' I mean that everybody has a basic approach to the way that they prefer to go about their work and communicate with others.
Research has discovered that all people — regardless of age, race, culture or gender — tend to behave and communicate in similar ways: One person you meet might be talkative, sociable and loud, whilst the next might be quiet, shy and methodical. Some people like structure and some don’t. Some like to move at a fast pace, others prefer to take their time. DISC is a framework for understanding these sorts of differences in people. The more you know about someone's preferred style, the better you will be able to predict how they will respond to certain situations. Ultimately, you can use this information to be more effective in your interactions with them, and learn the best way to communicate — as well as what things to avoid. And, best of all, once they are aware of your style, they can understand the best way to interact with you too.
In essence, you’ll benefit from more than 50 years of research that has proven that there are four types of basic behavioural preferences inherit in all people on earth. DISC is the 4-factor model that has simplified decades of research on how humans prefer to work, act, behave, socialise and communicate with each other, which you’re going to take advantage of and use to help understand how to interact more effectively with the people around you. Now, I bet you're wondering what DISC stands for...”
You may wish to include several pages from the DISC Resources Kit to give to them as a workbook. This workbook can serve as a visual reference with answers for them to fill in along the way, and also so they can have something to take home with them at the end of the session.
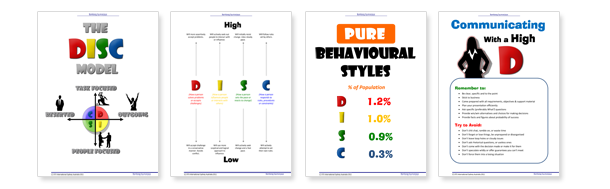
Also, as part of helping to explain the DISC model, you might wish to use some of these famous DISC characters as examples.
2. Explain the Graph Page
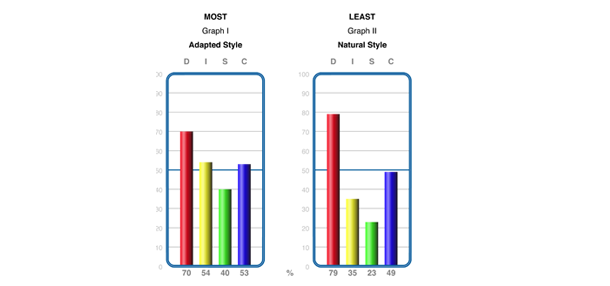
2 Graphs:
The Natural Graph (on the right) represents the person's most natural (or comfortable) behavioural preference. This is how a person would choose to behave with no external pressures acting on them. For example, when around close friends, family or at home when nobody is around. The Adapted Graph (on the left) represents the person's RESPONSE TO THE ENVIRONMENT (usually the workplace). People tend to adjust their natural behaviour in order to survive or succeed in a specific environment. Some call this graph the 'Work Style', 'Social Mask' or 'Public Persona'. The adapted graph is the MOST changeable, and can shift depending on the demands of the work environment, whereas the natural graph is LEAST changeable and tends to remain fairly consistent throughout the course of our lives (unless we experience a significant emotional event).
Numbers:
You will notice next to each graph the numbers 0-100:
- A high score might be considered between 60-100
- A mid-range score might be considered between 40-60
- A low score might be considered between 0-40
Energy Line:
The 50% line is called the "Energy Line." With any factor above the energy line on the natural graph, this means that the person does not have to exert energy in order to display that trait — it should be visible for the world to see. Conversely, any factor below the energy line on the natural graph means that the person will need to exert more energy if they wanted to show more of that trait. When a score is very high on their natural graph, it takes a lot of energy to push down (hide) that behaviour. When a score is very low, it takes a lot of energy to push up (show) that behaviour.
3. D Scale Feedback
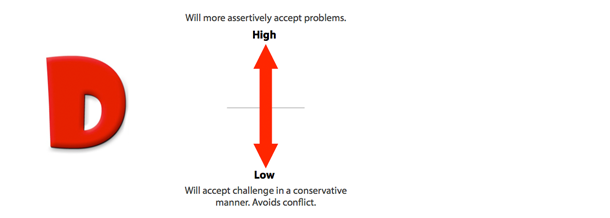
Explain the Scale:
The Dominance (D) scale measures how you deal with problems and challenges. The higher the score on the D scale, the more assertively a person will tend to tackle problems and challenges. The lower the score on the D scale, the less assertively they will approach problems and challenges. A low score doesn't mean the person can't take on challenges. It just means they prefer to approach them in a different way. They prefer to think things through first and take their time, rather than rushing headlong into a challenge "guns blazing."
People who score high on the D scale are often described as: Driving, Ambitious, Pioneering, Strong-Willed, Forceful, Determined, Aggressive, Competitive, Decisive, Venturesome.
People who score low on the D scale are often described as: Conservative, Calculating, Cooperative, Hesitant, Low-Keyed, Unsure, Undemanding, Cautious, Mild, Agreeable, Modest, Peaceful, Unobtrusive.
Natural Graph Feedback:
I can see from your natural graph that you…
- score in the high end.
- score in the mid-range.
- score in the low end.
Adapted Graph Feedback:
I can see from your adapted graph that you…
a) score roughly in the same spot (0-10 points shift). This is usually a good thing since it means that they are not expending much energy to change their behaviour in order to meet the demands of the work environment.
b) there is a bit of a shift. It is important to remember that a shift could be caused by a number of things; it is our job as an accredited facilitator to work through the graph and help the person find its meaning and relevance. E.g. If the "D" scale is moving up, it could be an indication that the person is having to take on more problems and challenges, having to be more assertive and decisive, or displaying a stronger focus on results. If the "D" scale is moving down, it could be an indication that the person is having to pull back from dealing with problems and challenges, being more cautious, or perhaps they are having to display — for whatever reason — a lesser focus on getting things done quickly.
Ask them to consider some reasons why they think the shift might be occurring.
4. I Scale Feedback
Explain the Scale:
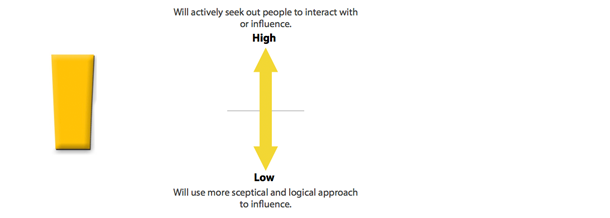
The Influence (I) scale measures how you interact with and attempt to influence people. The higher the score on the I scale, the more the person will attempt to seek out people to interact with and influence. The lower the score on the I scale, the less a person is likely to seek out people to interact with.
People who score high on the I scale are often described as: Effusive, Ongoing, Magnetic, Enthusiastic, Demonstrative, Persuasive, Warm, Convincing, Optimistic, Trusting, Sociable.
People who score low on the I scale are often described as: Reflective, Factual, Calculating, Sceptical, Logical, Suspicious, Matter-of-Fact, Incisive, Pessimistic, Critical.
Natural Graph Feedback:
I can see from your natural graph that you…
- score in the high end.
- score in the mid-range.
- score in the low end.
Adapted Graph Feedback:
I can see from your adapted graph that you…
a) score roughly in the same spot (0-10 points shift). This is usually a good thing since it means that they are not expending much energy to change their behaviour in order to meet the demands of the work environment.
b) there is a bit of a shift. It is important to remember that a shift could be caused by a number of things; it is our job as an accredited facilitator to work through the graph and help the person find its meaning and relevance. E.g. If the "I" scale is moving up, it could be an indication that the person is having to deal with more people and contacts, having to be more of a promoter, or developing a stronger focus on recognition (being seen and being heard). If the "I" scale is moving down, it could be an indication that the person is having to pull back from dealing with people, being more sceptical, or perhaps they are having to display — for whatever reason — a lesser focus on recognition.
Ask them to consider some reasons why they think the shift might be occurring.
5. S Scale Feedback
Explain the Scale:
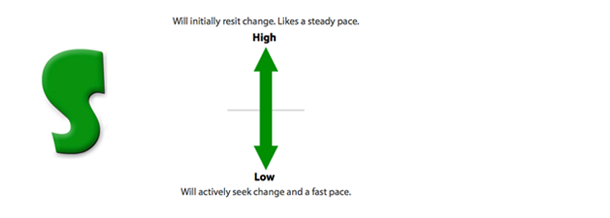
The Steadiness (S) scale measures how you deal with pace and consistency. The higher the score on the S scale, the more steady and consistent the person prefers their environment to be. The lower the score on the S scale, the more the person prefers their environment to be fast-paced and changing.
People who score high on the S scale are often described as: Phlegmatic, Relaxed, Non-demonstrative, Passive, Patient, Predictable, Consistent, Deliberate, Steady, Stable.
People who score low on the S scale are often described as: Mobile, Active, Restless, Alert, Variety-Oriented, Demonstrative, Impatient, Pressure-Oriented, Eager, Flexible, Impulsive, Impetuous, Hyper-tense.
Natural Graph Feedback:
I can see from your natural graph that you…
- score in the high end.
- score in the mid-range.
- score in the low end.
Adapted Graph Feedback:
I can see from your adapted graph that you…
a) score roughly in the same spot (0-10 points shift). This is usually a good thing since it means that they are not expending much energy to change their behaviour in order to meet the demands of the work environment.
b) there is a bit of a shift. It is important to remember that a shift could be caused by a number of things; it is our job as an accredited facilitator to work through the graph and help the person find its meaning and relevance. E.g. If the "S" scale is moving up, it could be an indication that the person is having to slow down the pace in the work environment, having to be more patient, stable and consistent, or developing a stronger focus on agreeable relationships (and not being confrontational). If the "S" scale is moving down, it could be an indication that the person is having to speed up their pace, being more active and mobile, or perhaps are having to display — for whatever reason — a lesser focus on peaceful relationships.
Ask them to consider some reasons why they think the shift might be occurring.
6. C Scale Feedback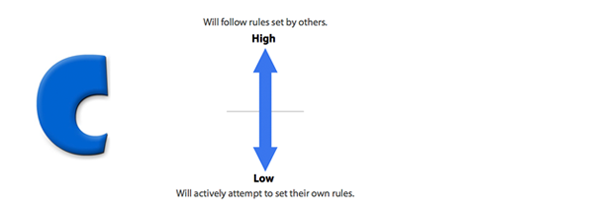
Explain the Scale:
The Compliance (C) scale measures how you deal with procedures and constraints. The higher the score on the C scale, the more the person is likely to abide by rules and regulations. The lower the score on the C scale, the less a person is likely to rely on rules and regulations.
People who score high on the C scale are often described as: Evasive, Worrisome, Careful, Cautious, Conventional, Exacting, Neat, Systematic, Diplomatic, Accurate, Tactful.
People who score low on the C scale are often described as: Independent, Opinionated, Unsystematic, Self-Righteous, Uninhibited, Arbitrary, Careless with Details.
Natural Graph Feedback:
I can see from your natural graph that you…
- score in the high end.
- score in the mid-range.
- score in the low end.
Adapted Graph Feedback:
I can see from your adapted graph that you…
a) score roughly in the same spot (0-10 points shift). This is usually a good thing since it means that they are not expending much energy to change their behaviour in order to meet the demands of the work environment.
b) there is a bit of a shift. It is important to remember that a shift could be caused by a number of things; it is our job as an accredited facilitator to work through the graph and help the person find its meaning and relevance. E.g. If the "C" scale is moving up, it could be an indication that the person is having to deal with more procedures and constraints, having to be more logical, systematic and analytical, or developing a stronger focus on caution (from fear of making a mistake). If the "C" scale is moving down, it could be an indication that the person is having to pull back from dealing with procedures, being more or a rule breaker, or perhaps are having to display — for whatever reason — a lesser focus on getting things done "perfectly right."
Ask them to consider some reasons why they think the shift might be occurring.
7. Action Steps
What Did You Learn?
Review the DISC model and their DISC graph. Ask them to summarise their understanding to ensure they walk away with a clear grasp of the DISC theory and principles. You may wish to ask them a few quick revision questions, for example:
- Q. What does DISC measure? A. Behavioural preferences, not skills.
- Q. What is the best DISC style? A. There is no best style.
- Q. Without looking, can you re-draw your DISC graph?
- Q. What are the benefits of knowing someone's DISC style?
- Q. What are some of the common strengths of each of the 4 styles?
- Q. What are some of the common limitations of each of the 4 styles?
What Steps to Take?
What will they do now that they have these new insights? You may wish to have them write down a list of action steps to take when they get back to work. This may include cutting out their DISC graph and sticking it next to their computer, or sharing select pages from their profile with key individuals.
Who Needs to Know?
You might wish to help them make a list of the important people in their life whose cooperation, commitment and contribution they need to be effective and productive — both professionally and personally:
- Business Partner
- Boss
- Other Managers
- Co‐Workers
- Employees
- Key Clients
- Suppliers
- Advisors
- Spouse
- Family Members
- Friends
This is a good chance to have them think about what other people's DISC styles might be, and how they can adapt their own style in order to be more effective in their interactions with those people. This is also a good chance to invite those people to take the DISC profile.
Related Information:

.png?width=374&name=Advantages%20of%20the%20TTSI%20disc%20profile%20(1).png)
/how%20do%20motivators%20%20effect%20your%20disc%20profile.png?width=374&name=how%20do%20motivators%20%20effect%20your%20disc%20profile.png)
We Would Like to Hear From You (0 Comments)